Quick answer: EUR/AUD technical analysis works best when the standard tools — support and resistance, moving averages, Fibonacci retracements — are read alongside the pair’s two separate drivers: ECB policy and Eurozone data on the euro side, commodity prices and Chinese economic data on the Australian dollar side.
Why EUR/AUD Needs a Different Approach Than a Major Pair
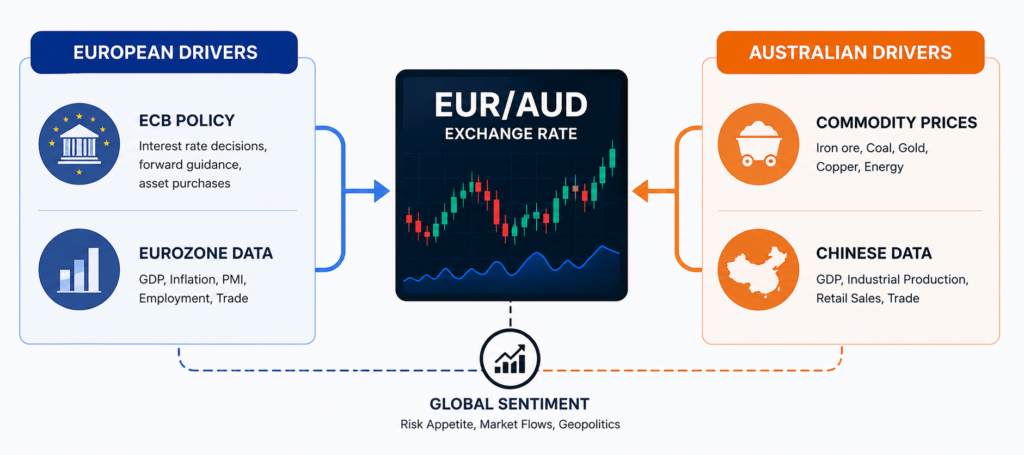
EUR/AUD is classified as a minor pair because it doesn’t include the US dollar, which generally means lower liquidity and the potential for wider spreads compared to a major like EUR/USD. That’s a practical consideration for order execution, but the more important difference for technical analysis is structural: EUR/AUD has two independent sets of fundamental drivers layered underneath the chart, not one.
- The euro side responds to European Central Bank policy decisions and Eurozone economic data — inflation, growth, and employment figures out of the currency bloc.
- The Australian dollar side is widely considered a commodity currency. Commodity export prices — iron ore in particular — and the health of the Chinese economy, Australia’s largest trading partner, are closely watched drivers, alongside Reserve Bank of Australia interest rate policy.
A purely technical setup on EUR/AUD can be overridden by a shift on either side independently — a Chinese economic data surprise can move the pair even when nothing has changed in the Eurozone, and vice versa. That’s the single biggest adjustment traders coming from a major pair need to make.
Best Indicators for EUR/AUD Technical Analysis
| Indicator | What it tells you | Watch for |
|---|---|---|
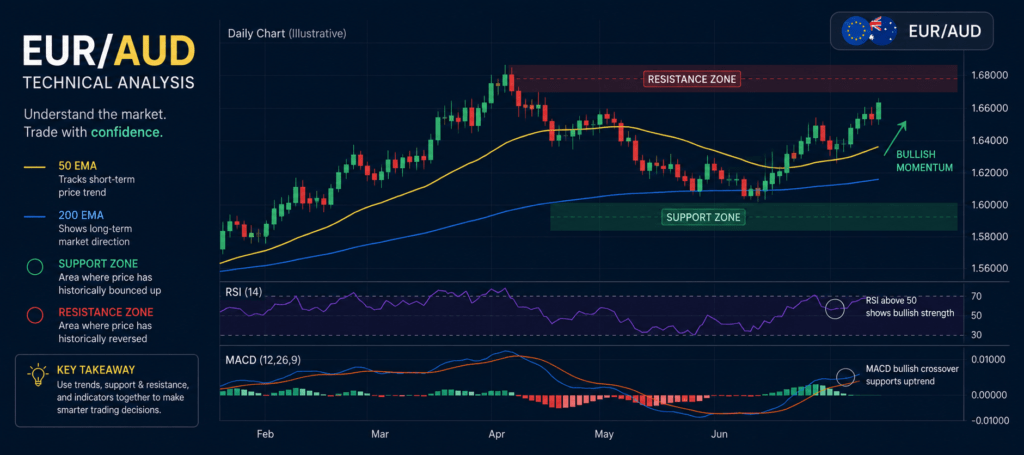
| Support and Resistance | Where price has previously reversed | Genuine rejection candles, not every touch |
| Moving Average (e.g. 50 EMA) | The prevailing trend direction | Trend holding despite mixed signals from one side |
| Fibonacci Retracement | Likely pullback zones within a trend | Confirmation, not a guaranteed bounce |
| Pivot Points | Intraday bullish/bearish bias | Combine with trend, don’t use alone |
1. Support and Resistance
Mark prior swing highs and lows on the Daily or 4H chart. Because EUR/AUD can see sharper moves around Chinese data releases or RBA/ECB decisions than a major pair might on comparable news, price often approaches these levels with more momentum — watch for a genuine rejection (a pin bar or engulfing candle) rather than treating every touch of a level as an automatic bounce.
2. Moving Averages
A moving average (such as a 50-period EMA) on the Daily chart helps establish the prevailing trend direction before you weigh entries. Given the dual-driver nature of this pair, a trend that holds despite mixed signals from one side (say, softening Eurozone data) is often a sign the other side (Australian dollar drivers) is dominating price action — worth noting rather than ignoring.
3. Fibonacci Retracements
Fibonacci levels can help identify likely reaction zones during a pullback within an established trend. As with any pair, treat these as probability zones to watch for confirmation, not guaranteed turning points — this matters especially on EUR/AUD, where a genuine fundamental shift on either side can blow through a Fibonacci level without hesitation.
4. Pivot Points
Daily or weekly pivot points give a quick reference for where price is relative to its recent range, useful for gauging whether EUR/AUD is trading in bullish or bearish territory intraday. Combine with the trend read from your moving average rather than using pivots in isolation.
A Practical Way to Combine Technicals With the Two-Driver Structure
Before applying any of the indicators above, a quick check of what’s actually driving each side of the pair helps interpret what the chart is showing:
- Check an economic calendar for scheduled ECB decisions, Eurozone inflation/growth data, RBA decisions, and major Chinese economic releases (GDP, trade data, PMI) — these are the events most likely to override a technical setup.
- If a technical level breaks cleanly around one of these releases, treat it as a fundamentals-driven move rather than a pure technical breakout, and size accordingly — fundamentals-driven moves can extend further than a typical technical breakout.
- If both sides are quiet (no major scheduled data), the standard technical read tends to hold more reliably, since there’s less risk of a fundamental override.
This dual-driver dynamic isn’t theoretical — periods where the RBA and ECB are moving their policy rates in different directions (one cutting while the other holds or hikes) have historically produced some of EUR/AUD’s larger sustained trends, as the interest-rate differential between the two economies widens or narrows. That’s a genuinely different setup from a single-driver pair, where the trend is usually explained by one side’s story, not two.
If you’re newer to reading charts generally rather than pair-specific dynamics, our guide to top forex trading indicators for beginners covers the fundamentals before applying them to a cross pair like this one. And for a technique that strips indicators out entirely and reads price movement directly, see our piece on reading price action without indicators — useful context for why the tools above are a starting point, not the whole picture.
Common Mistakes Trading EUR/AUD
- Treating it like a major pair. Applying a EUR/USD playbook directly to EUR/AUD without accounting for lower liquidity and the added Australian dollar/commodity driver.
- Watching only Eurozone news. Missing a Chinese data release or RBA decision that moves the Australian dollar side independently of anything happening in Europe.
- Ignoring the wider spread. Not accounting for potentially wider spreads on a minor pair when calculating risk-reward on a trade.
Key Takeaways
- EUR/AUD technical analysis uses the same core tools as any pair — support/resistance, moving averages, Fibonacci, pivot points — but needs to account for two independent driver sets, not one.
- The euro side tracks ECB policy and Eurozone data; the Australian dollar side tracks commodity prices, Chinese economic data, and RBA policy.
- Check the economic calendar for both sides before trusting a purely technical setup — a fundamental shift on either side can override the chart.
- Zoom out regularly — the key forex market trends to watch give the macro backdrop these EUR/AUD signals play out against.
Frequently Asked Questions
What are the best indicators for EUR/AUD technical analysis?
Support and resistance, moving averages, and Fibonacci retracements are the most commonly used — but for EUR/AUD specifically, pairing technicals with an awareness of ECB and RBA policy divergence matters more than on a major pair.
Why is EUR/AUD different from a pair like EUR/USD?
EUR/AUD is a minor pair (it doesn’t include the US dollar), which generally means lower liquidity and potentially wider spreads than major pairs. It’s also a dual-driver pair: the euro side responds to ECB policy and Eurozone data, while the Australian dollar side responds heavily to commodity prices and Chinese economic data.
Is EUR/AUD good for beginners?
It can be more complex than a major pair because it requires tracking two separate sets of drivers rather than one. Traders newer to forex may find a major pair simpler to start with before adding a cross pair like EUR/AUD.
What makes the Australian dollar move?
The Australian dollar is widely considered a commodity currency, with commodity export prices (particularly iron ore) and the health of the Chinese economy — Australia’s largest trading partner — among its most closely watched drivers, alongside RBA interest rate policy.